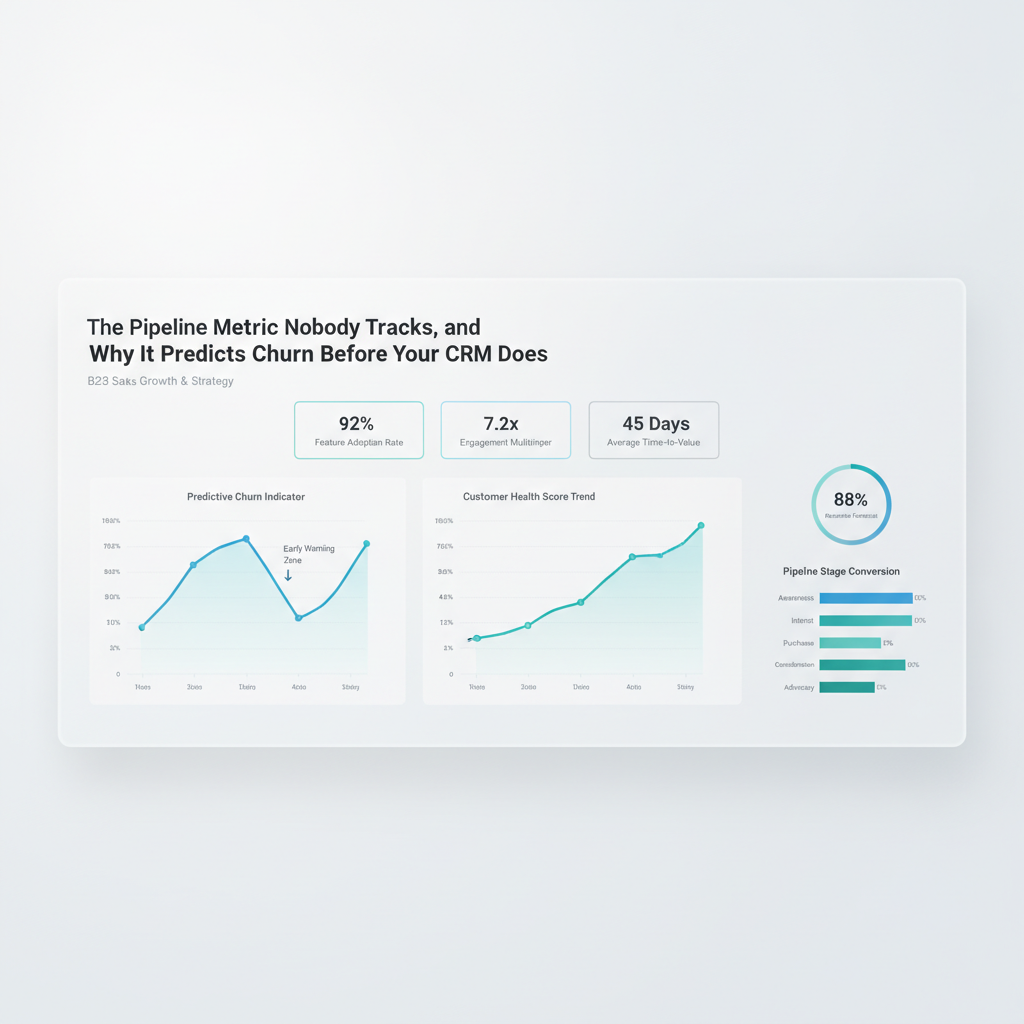
Most B2B SaaS teams think pipeline quality problems start in the CRM. They usually do not. By the time a dashboard shows stalled opportunities, low conversion rates, or a sudden drop in expansion potential, the underlying issue has often been building for weeks upstream. The metric that exposes that issue earlier is not lead volume, win rate, or stage conversion. It is pipeline velocity by intent quality.
That phrase sounds more complicated than it is. It simply means measuring how fast opportunities move when segmented by the strength and clarity of the buyer intent that created them. Most teams track velocity at the aggregate level. Almost nobody tracks whether high-intent opportunities are slowing down, whether low-intent opportunities are filling the funnel, or whether the mix itself is deteriorating before churn risk shows up in customer data.
What Is Pipeline Velocity by Intent Quality and Why Does It Matter?
Pipeline velocity by intent quality is the rate at which opportunities progress through the funnel when grouped by the level of buying intent that brought them in. Intent quality can be inferred from signals such as problem-aware content consumption, demo request context, product comparison behavior, repeat visits to commercial pages, and the specificity of the use case attached to the opportunity. The point is not to build a perfect score. The point is to separate weak curiosity from serious buying motion.
This matters because aggregate pipeline metrics hide mix deterioration. A team can report healthy pipeline creation while quietly replacing high-conviction opportunities with lower-intent names that move slowly, require more sales effort, and convert into weaker-fit customers. That is the pattern that often predicts future churn before customer success dashboards catch it. If the front end of the funnel starts filling with buyers who were never a strong fit, the back end eventually pays for it.
Why This Metric Predicts Churn Earlier Than CRM Dashboards
Most churn reporting is lagging by design. It tells you what existing customers did after onboarding, adoption, and renewal behavior had time to unfold. Pipeline velocity by intent quality is earlier. It reveals whether the business is increasingly acquiring customers who move like poor-fit buyers from the start. When low-intent opportunities begin taking over the funnel, three things usually happen in sequence.
- Sales cycles lengthen because buyers need more education and more internal justification.
- Discount pressure rises because the product is being sold into weaker urgency and lower perceived value.
- Retention quality declines because customers who entered without a sharp problem definition are less likely to reach durable product adoption.
By the time churn appears in the CRM or customer success platform, the acquisition pattern that caused it may already be several quarters old. That is why this metric matters. It is not just a sales efficiency indicator. It is an early warning system for customer quality.
How Tracking Intent Quality Solves the False Efficiency Problem
Many teams celebrate lower cost per lead, higher top-of-funnel volume, or a surge in pipeline creation without asking whether the underlying intent mix improved or deteriorated. That creates false efficiency. The business appears to be scaling because more names are entering the funnel, but the commercial engine is actually getting noisier and less efficient.
Tracking velocity by intent quality changes the conversation. It forces marketing, sales, and RevOps to ask whether demand generation is producing buyers with real urgency, whether qualification standards are drifting, and whether pipeline growth is coming from stronger demand or simply looser gates. It also creates a cleaner bridge between acquisition and retention, because it treats customer quality as something visible before the deal closes.
Pipeline Velocity by Intent Quality vs. Standard Pipeline Reporting
| Parameter | Standard Pipeline Reporting | Velocity by Intent Quality |
|---|---|---|
| Primary view | Total pipeline volume and stage movement | Stage movement segmented by buyer intent strength |
| Main question answered | How much pipeline exists? | What kind of buyers are moving through it? |
| Typical blind spot | Mix deterioration hidden inside aggregate numbers | Exposes weak-fit opportunities earlier |
| Commercial value | Forecasting near-term revenue | Forecasting revenue quality and retention risk |
| Best use | Operational reporting | Strategic diagnosis across marketing, sales, and CS |
Step-by-Step Guide to Measuring It
- Define a simple intent model using observable signals, not theoretical scoring perfection. Start with high, medium, and low intent.
- Tag opportunities at creation based on source behavior, page paths, form context, and sales qualification notes.
- Measure stage-to-stage velocity separately for each intent tier over time.
- Compare close rates, average discounting, and early retention outcomes across those tiers.
- Review the mix monthly to see whether pipeline growth is coming from stronger or weaker intent cohorts.
The goal is not to create another complicated dashboard. It is to make buyer quality visible early enough for the business to respond. Even a rough model is more useful than a perfect model that never gets implemented.
Key Challenges and How to Overcome Them
The first challenge is data discipline. Intent quality often lives across marketing automation, product analytics, and sales notes, which means the signal is fragmented. The fix is to start with a narrow set of observable behaviors and apply them consistently rather than waiting for a unified data model. The second challenge is organizational resistance. Teams that are rewarded for volume may not want a metric that reveals declining buyer quality. That is exactly why the metric is useful. It shifts the conversation from how much pipeline was created to whether the business is creating the right pipeline.
Conclusion and Next Steps
The pipeline metric nobody tracks is not hidden because it is technically difficult. It is hidden because aggregate reporting is easier to defend. But if you want to predict churn earlier than your CRM can, start by asking a more uncomfortable question upstream: are your fastest-moving opportunities still your best-fit buyers, or has the mix already changed? Audit the last two quarters of pipeline by intent tier, compare velocity and retention outcomes, and the answer usually appears faster than most teams expect.
Want more data-first analysis for senior SaaS leaders? Explore more insights on B2B SaaS Signal or subscribe for new editorial briefings.
